


Recently, I sat down to tweak the performance of FlutterFolio, an app that was built as a design showcase for Flutter Engage. With a single change, I made FlutterFolio significantly faster.
But, first, I had to search for what to change. This article is about that search.
FlutterFolio is a fully functional app that was created in 6 weeks (!) from design to implementation, for mobile, desktop, and the web. The development team clearly had to cut some corners — no judgement there. The scope of the project and the very short timeline forced them to do that.https://cdn.embedly.com/widgets/media.html?src=https%3A%2F%2Fwww.youtube.com%2Fembed%2Fx4xZkdlADWo%3Ffeature%3Doembed&display_name=YouTube&url=https%3A%2F%2Fwww.youtube.com%2Fwatch%3Fv%3Dx4xZkdlADWo&image=https%3A%2F%2Fi.ytimg.com%2Fvi%2Fx4xZkdlADWo%2Fhqdefault.jpg&key=a19fcc184b9711e1b4764040d3dc5c07&type=text%2Fhtml&schema=youtube
In fact, this presents a great opportunity, because the app is more “real life” than all the sample apps I can think of.
And, performance optimization is better explained on real life apps than on synthetic problems.
Step 1: Performance profiling
What’s the first step of any optimization? Measurement. Knowing that an app seems slow doesn’t cut it. You need to be a bit more precise. Two reasons:
- The measurement can point us in the direction of the worst offenders. Every part of every app can be made faster and more efficient. But, you have to start somewhere. Performance profiling lets us see which parts are doing OK and which parts are doing poorly. We can then focus on the parts that are doing poorly, and make more progress in our limited time.
- We can compare the before and the after. Sometimes, a code change seems like a good idea, but in reality, it doesn’t make a significant difference. Having a baseline (the before) means that we can quantify the effect of our changes. We can compare the before with the after.
Performance profiling of apps is hard. I wrote a long article about it in 2019. So, let’s start simple. We run the app in profile mode, turn on the performance overlay, and use the app, while watching the performance overlay graph.
Immediately, we see that the Raster thread is struggling.
This happens especially when scrolling through the home page of the app. You should always prioritize the parts of the app where the user spends most of their time or where performance problems are especially noticeable to the user. In other words, if you have two performance problems, and one of them happens on the start screen, and the other one is buried in the settings page, fix the start screen first.
Let’s look at what the Raster thread is doing.
Aside: UI thread versus Raster thread
Actually, let’s first clarify what the Raster thread does.
All Flutter apps run on at least two parallel threads: the UI thread and the Raster thread. The UI thread is where you build widgets and where your app logic runs. (You can create isolates, which means that you can run your logic on other threads, but, for simplicity, we’ll ignore that.) The Raster thread is what Flutter uses to _rasterize_ your app. It takes instructions from the UI thread and translates them into something that can be sent to the graphics card.
To be more concrete, let’s have a look at a build function:
Widget build(BuildContext context) {
  return Image.asset('dash.png');
}
The above code runs on the UI thread. The Flutter framework figures out where to place the widget, what size to give it, and so on — still on the UI thread.
Then, after Flutter knows everything about the frame, it’s over to the Raster thread. The Raster thread takes the bytes in `dash.png`, resizes the image (if needed), and then applies opacity, blend modes, blur, and so on, until it has the final pixels. The Raster thread then sends the resulting information to the graphics card, and, therefore, to the screen.
Step 2: Digging into the timeline
OK, back to FlutterFolio. Opening Flutter DevTools lets us look more closely at the timeline.
On the Performance tab, you can see that the UI thread (the pale blue bars) is doing quite well, while the Raster thread (the dark blue and red bars) is taking a surprising amount of time for each frame, especially when scrolling down the home page. Therefore, the problem isn’t inefficient build methods or business logic. The problem is asking the Raster thread to do too much.
The fact that every frame spends a long time on the Raster thread tells us something. It says that we’re asking the Raster thread to do some work over and over — it’s not something being done once in a while.
Let’s pick a frame and look at the Timeline Events panel..
The top part of the timeline, with the light gray background, is the UI thread. Once again, you can see that the UI thread is not the problem.
Below the UI thread, you see the events on the Raster thread, starting with GPURasterizer:Draw. Unfortunately, this is where things get a little hazy. There are a lot of calls to exotic-sounding methods such as TransformLayer::Preroll, OpacityLayer::Preroll, PhysicalShapeLayer::Paint and so on. There are no details about what’s going on in these methods, and these are not names most Flutter developers recognize.
They are C++ methods from the Flutter Engine. If you feel like it, you can do a search for these method names, and read the code and the comments to see what’s going on under the hood. Sometimes, this can give you a bit more intuition about what the Raster thread is doing. But, this type of research is not strictly required to find performance problems. (I didn’t do this until relatively recently, and, yet, I was able to optimize the performance of quite a few apps.)
Then, there’s the long event labeled SkCanvas::Flush. It takes 18 milliseconds, which is way above reasonable. Unfortunately, that event also lacks any detailed information, so we’ll need to play detective a bit.
The Sk in SkCanvas stands for Skia, the graphics engine that Flutter uses for rendering at the very bottom of its stack. SkCanvas is a low-level C++ class, similar to Flutter’s own Canvas (which you might be familiar with if you work with CustomPaint). All of your app’s pixels, lines, gradients — all of the UI — goes through SkCanvas. And, SkCanvas::Flush is where this class does most of its work after it gathers all the information it needs. The documentation says that the Flush method “resolves all pending GPU operations.”
Let’s review what we learned from the performance timeline:
- The Raster thread is the major problem. The UI thread is doing relatively fine.
- While scrolling, the Raster thread takes a long time for _every frame_. Some expensive rasterization work is being done all the time.
- `SkCanvas::Flush` takes a long time, which means that Skia is doing a lot of homework.
We do not know what that homework is. Let’s review the code.
Step 3: Read the code
Armed with knowledge, let’s look at the source code. If the code is unfamiliar (as it was for me in the case of FlutterFolio), it pays to switch from profile mode to debug mode, and use the Flutter Inspector to jump to the source code of the relevant widgets.
FlutterFolio’s home page, at least on mobile devices, seems to be, basically, a vertical PageView populated with BookCoverWidgets. Looking at BookCoverWidget, you can see that it’s essentially a Stack of various widgets, starting with a large image at the bottom, continuing with some animated overlays, the main text content, and ending with a mouse-over overlay at the top.
child: Stack(fit: StackFit.expand, children: [
/// /////////////////////////////
/// Background Image
// Animated scale for when we mouse-over
AnimatedScale(
duration: Times.slow,
begin: 1,
end: isClickable ? 1.1 : 1,
child: BookCoverImage(widget.data),
),
/// Black overlay, fades out on mouseOver
AnimatedContainer(duration: Times.slow,
color: Colors.black.withOpacity(overlayOpacity)),
/// When in large mode, show some gradients,
/// should sit under the Text elements
if (widget.largeMode) ...[
FadeInLeft(
duration: Times.slower,
child: _SideGradient(Colors.black),
),
FadeInUp(child: _BottomGradientLg(Colors.black))
] else ...[
FadeInUp(child: _BottomGradientSm(Colors.black)),
],
/// Sit under the text content, and unfocus when tapped.
GestureDetector(behavior: HitTestBehavior.translucent,
onTap: InputUtils.unFocus),
/// BookContent, shows either the Large cover or Small
Align(
alignment: widget.topTitle ? Alignment.topLeft : Alignment.bottomLeft,
// Tween the padding depending on which mode we're in
child: AnimatedContainer(
duration: Times.slow,
padding: EdgeInsets.all(widget.largeMode ? Insets.offset : Insets.sm),
child: (widget.largeMode)
? LargeBookCover(widget.data)
: SmallBookCover(widget.data, topTitle: widget.topTitle),
),
),
/// Mouse-over effect
if (isClickable) ...[
Positioned.fill(child: FadeIn(child: RoundedBorder(color: theme.accent1, ignorePointer: false))),
],
]),
Now, remember: you’re looking for something that happens in every frame (that is, it’s always present), and that is potentially expensive for the Skia renderer to draw (images, blurs, blends, and so on).
Step 4: Drill down
Now, you need to drill down to find widgets that might be problematic. One way to do this is to temporarily remove various widgets from the app and see what kind of effect this has on the performance.
Remember, the first child of the Stack is the background, and every subsequent child is a layer on top of the previous widgets. So, the first child is the background image, represented by BookCoverImage. You could remove it, but the homepage would look like this:
That defeats the purpose of the whole page. Looking closer at BookCoverImage, you can see that it’s just a simple wrapper around Image. With one notable exception (mentioned later in this article), there isn’t much that could be improved here.
Moving on, there’s this code:
/// Black overlay, fades out on mouseOver
AnimatedContainer(duration: Times.slow,
color: Colors.black.withOpacity(overlayOpacity)),
This is a widget that covers the whole image with a layer of transparent black. overlayOpacity is 0 by default (and most of the time), so this layer is fully transparent. Hmm. Let’s remove it, and run the app in profile mode again.
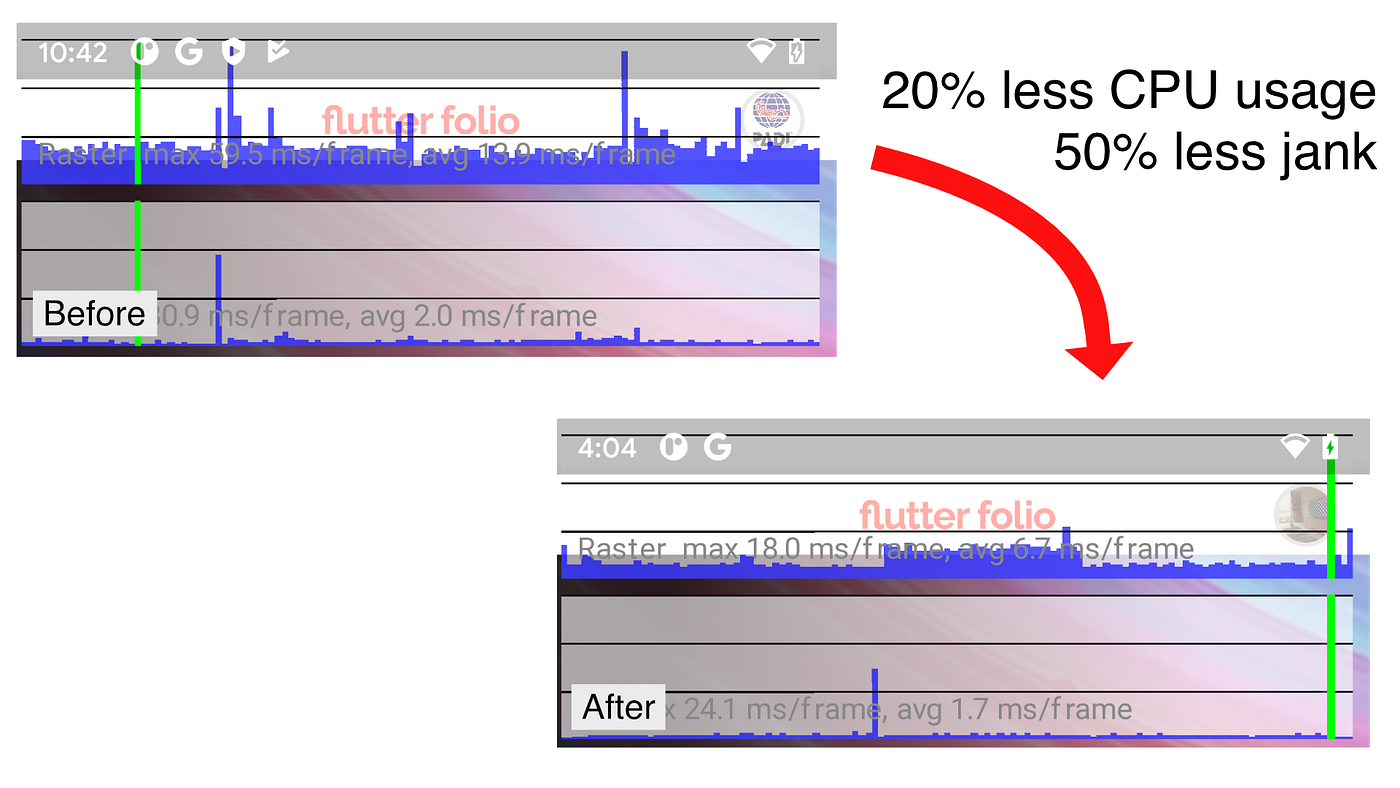
Interesting! The Raster thread still takes quite a lot of load, but there is a major performance improvement.
I decided to implement a more robust performance profiling tool for FlutterFolio, so that I can prove that the improvement is real and not just a fluke. This change gives me an impressive 20% less CPU time spent rasterizing overall and 50% less potential jank.
All in all, this is a massive change for removing a single widget that does nothing most of the time.
The fix is simple:
/// Black overlay, fades out on mouseOver
if (overlayOpacity > 0)
AnimatedContainer(duration: Times.slow,
color: Colors.black.withOpacity(overlayOpacity)),
Now, you only add the transparent overlay when it has non-zero opacity (that is, it’s at least partially visible). You avoid the (very common!) scenario in which a completely transparent layer is created and rasterized, but doesn’t have any effect.
And, just like that, the app is both smoother and more battery efficient.
Note: Why do you need to do this? Shouldn’t Flutter be smart enough to make this optimization for us? Read the issue here to learn why it can’t. And why is the transparent opacity slow in the first place? That is out of scope of this article but it has to do with a BackdropFilter widget further up the Stack that interacts with every widget below it.
The main point of this article isn’t to teach you about this particular performance pitfall. You might never see it again. My goal is to teach you how to optimize Raster thread performance in general.
Step 5: Generalize
Before moving on to a completely different issue, it’s often a good idea to look elsewhere in the project for similar problems. Are there other places in our app with large-area overlays? Can you avoid them?
In this case, the next few lines create large gradients that fade in as you scroll:
/// When in large mode, show some gradients,
/// should sit under the Text elements
if (widget.largeMode) ...[
FadeInLeft(
duration: Times.slower,
child: _SideGradient(Colors.black),
),
FadeInUp(child: _BottomGradientLg(Colors.black))
] else ...[
FadeInUp(child: _BottomGradientSm(Colors.black)),
],
And, sure enough, removing these animated, almost-full-screen gradients significantly improves the scrolling performance. Unfortunately, in this case, the solution isn’t as simple as with the previous example. These gradients aren’t invisible. They start fading in as soon as the user reaches that cover. Removing them does make a visual difference.
One idea is to delay the fade in for a bit, so that the animation only starts when the user lands on a specific BookCover. That way, you can lighten the Raster thread’s load while the user is scrolling, and hopefully avoid some of the potential jank.
But, that’s a change to the app’s motion design, and so it needs to be discussed with the larger team. Many performance optimizations will fall into this category. Performance optimization is often an exercise in compromise.
Repeat Steps 2–5 until happy
We’ve only looked at one type of problem so far. There are always more.
Here is one idea about what to do next: are the app’s image assets too large? Remember, the Raster thread is in charge of taking image bytes, decoding them, resizing, applying filters and so on. If it’s loading and resizing a 20 MB high-definition image into a tiny avatar image on a screen, then you’re wasting resources.
When your app is running in debug mode, you can use Flutter Inspector to invert oversized images.
This will color invert and flip all images in your app that are too large for their actual use. You can then peruse the app and watch for unnatural changes.
The debug mode also reports an error every time it encounters such an image, for example:
[ERROR] Image assets/images/empty-background.png has a display size of 411×706 but a decode size of 2560×1600, which uses an additional 19818KB.
The fix here isn’t straightforward, though. On mobile, you don’t need a 2560×1600 image, but on desktop, you might. And, remember, FlutterFolio is an app that runs on all of Flutter’s targets, including desktop. If in doubt, read the API docs.
Conclusion
As you can see, optimizing performance is an art and a science. Robust benchmarking helps and so does an intimate understanding of the framework and its built-in widgets.
Ultimately, practice makes perfect. Optimize enough apps, and you get better.
Happy hunting.

Like (7)